Story:
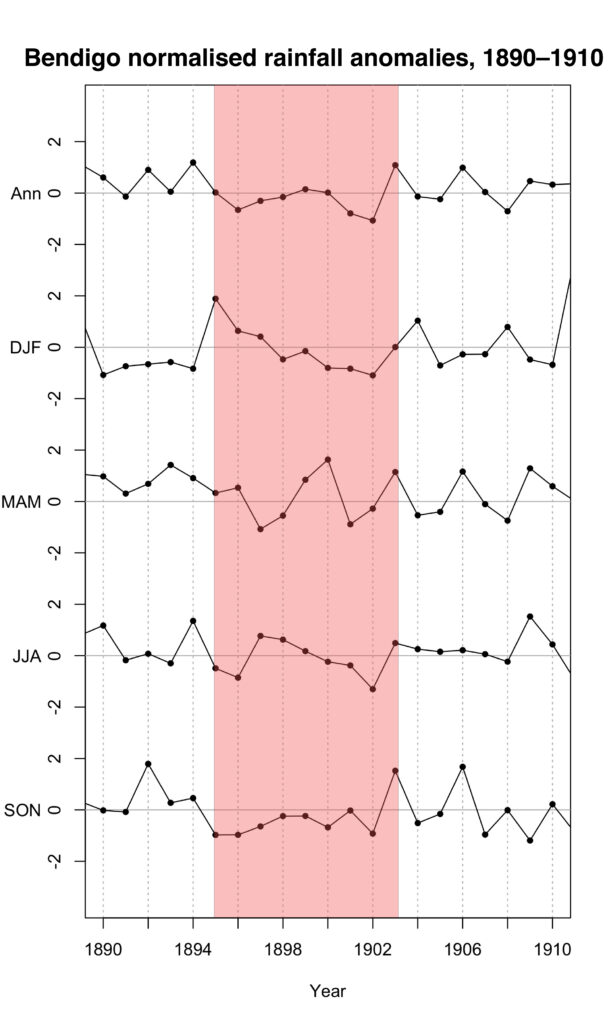
This plot shows rainfall variability in each season in Bendigo during the Federation Drought (1895–1903). The rainfall amounts have had the average for each season subtracted so we can see what is above or below ‘normal’. These values have then been divided by the standard deviation (or variability) of the rainfall for each season, so we can compare the seasons on one plot. Splitting the rainfall in this way shows us the drought was punctuated by some wetter than average autumns (March–May, MAM) and winters (June–August, JJA), but spring (SON) was drier than average throughout. We can also see the most severe year of the drought, 1902, is associated with below average rainfall in all four seasons. It’s important to understand the seasonality of the rainfall because crop success relies on the timing of rain, not just the amount. Research is also showing that Victoria’s rainfall patterns are changing, with less rain arriving in winter and more in the summer in the last few decades as our weather patterns shift southwards.
