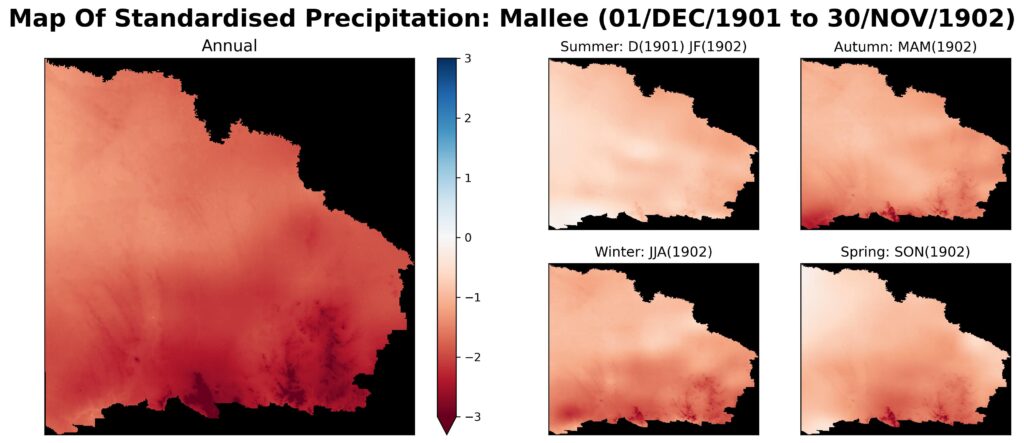
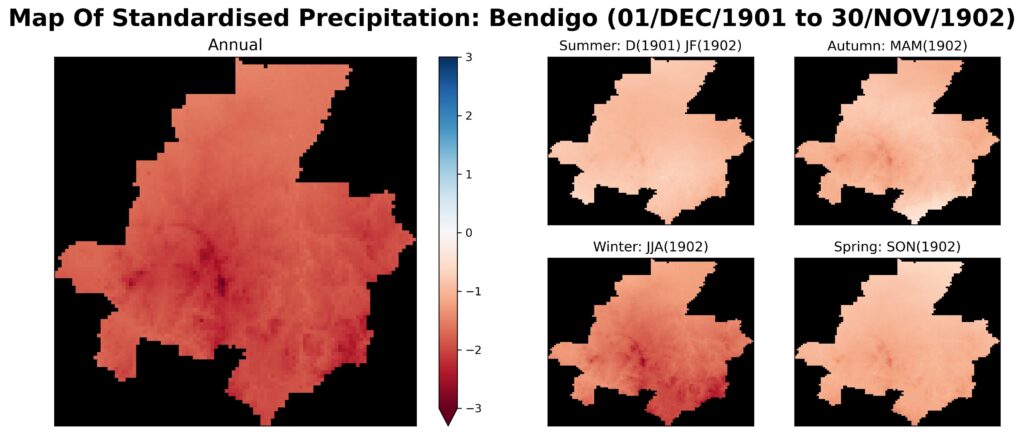
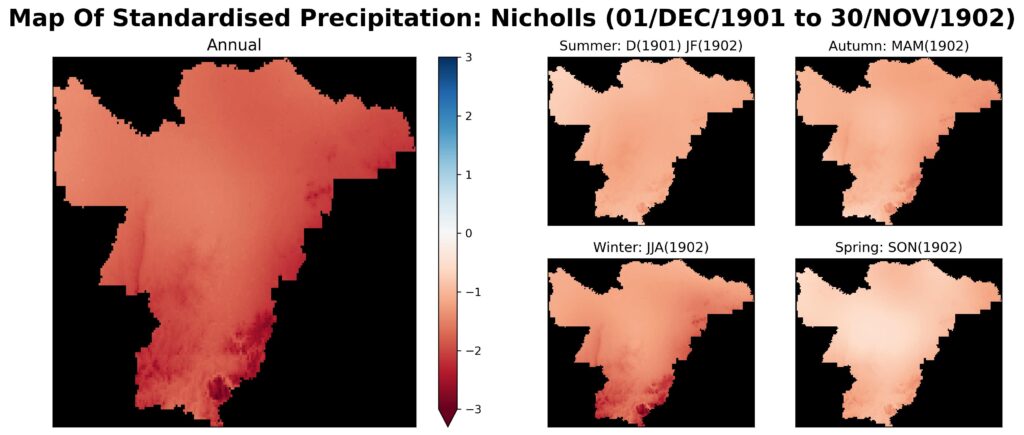
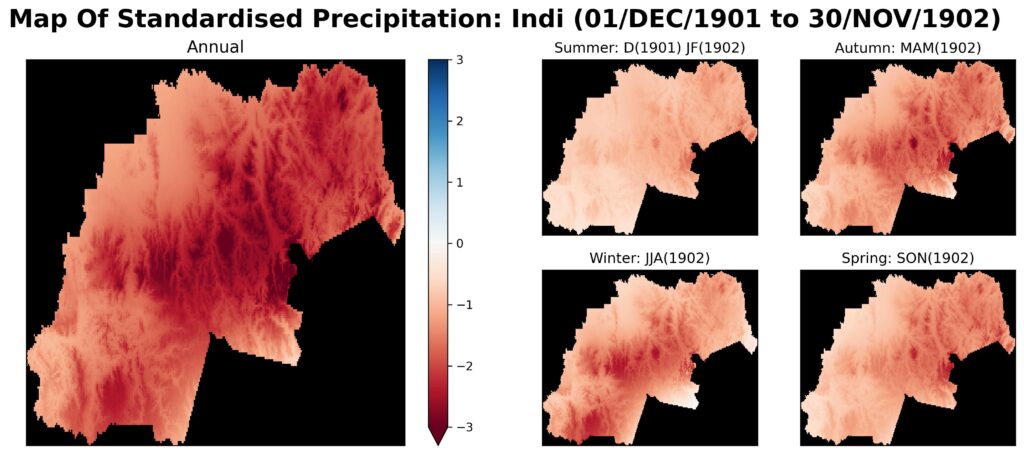
These maps shows seasonal rainfall difference – summer, autumn, winter, spring – in each region during 1902, the most severe year of the Federation Drought. It also highlights differences according to location. [The maps were prepared by Jarrad Rowe, a then undergraduate student at The University of Melbourne, supported by a scholarship from the ARC Centre of Excellence for Climate Extremes.


