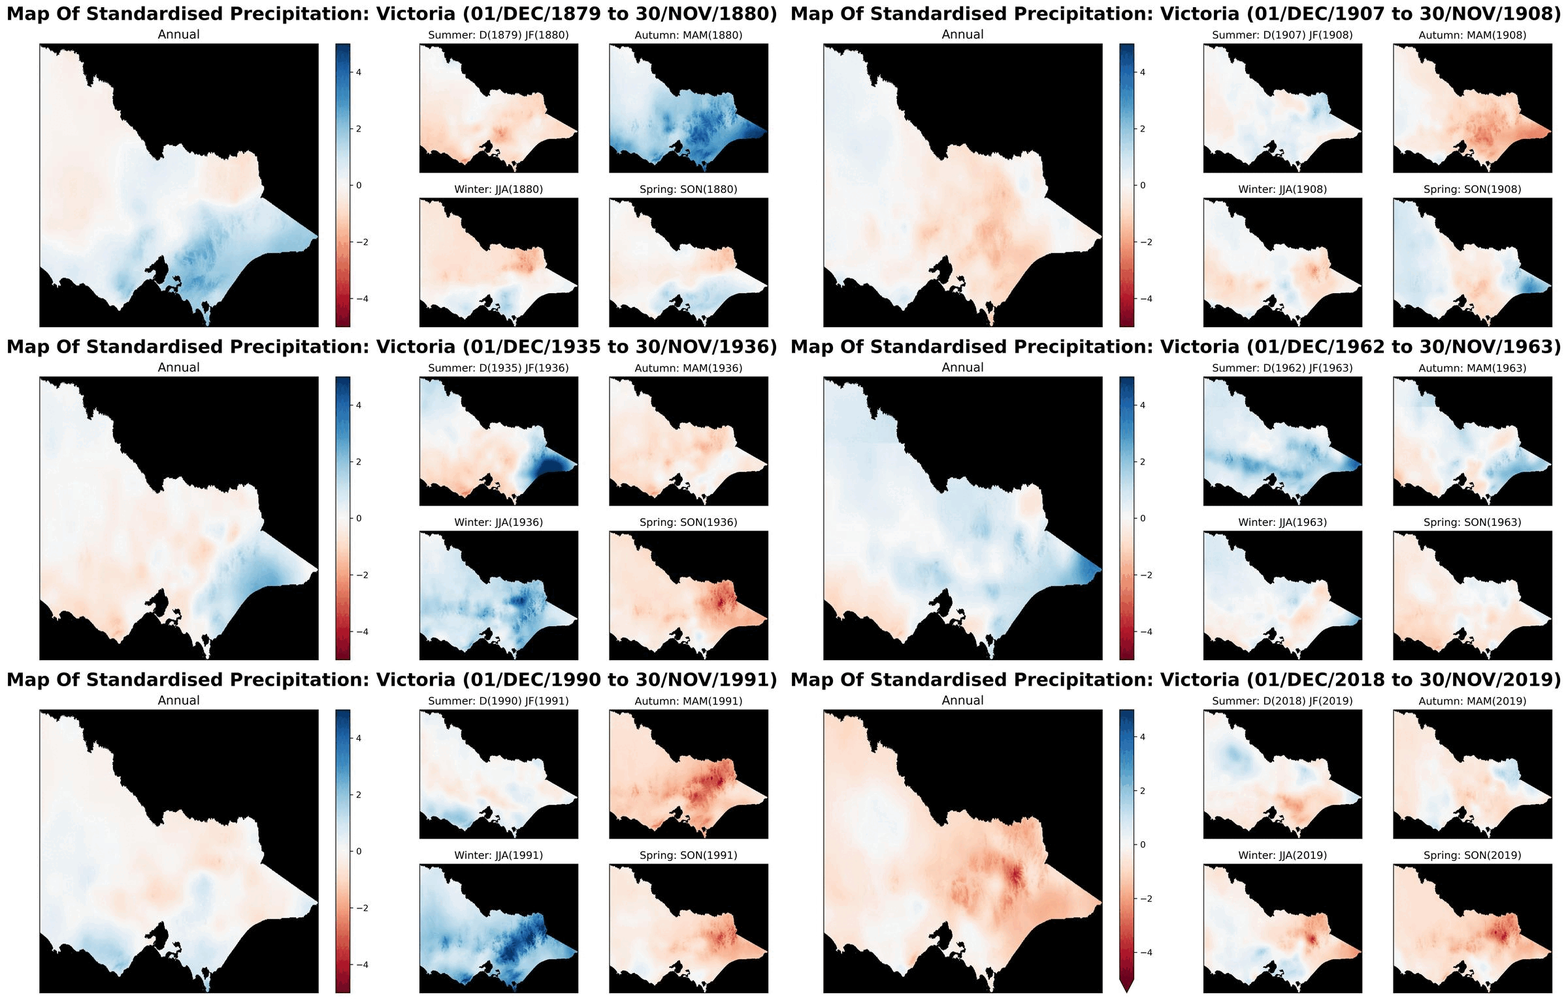
This animated map shows the rainfall patterns over Victoria from 1880 to 2019 using a detailed dataset from the Bureau of Meteorology. The maps don’t show rainfall totals in millimetres, but instead show the normalised rainfall values, where the long-term average is subtracted from the annual or seasonal value, and that number is then divided by a metric of variability. Looking at the rainfall this way allows us to meaningfully compare the relative wet or dry patterns across the entire state, rather than simply seeing the average climate for each location. Positive values (in blue) indicate wetter than average, while negative values (red) show drier than average locations for that period. A year is taken from December one year to November the next, to keep the western seasons together.
The gif moves through 140 years of annual and seasonal rainfall, showing the emergence and sometimes abrupt endings of droughts and wet periods. The smaller seasonal maps also allow us to identify whether a year is dry because of a lack of rain in summer, autumn, winter or spring.
There are some clear regional patterns that stand out when watching the maps run through Victoria’s rainfall history. Southern and Eastern Gippsland often have a different rainfall signature to the rest of the state, for example, while values in the Alpine region are generally higher, likely due to the higher absolute rainfall totals recorded there. The final year of the Federation Drought, 1902, stands out as one particularly ‘red’ map across almost all of Victoria, as does 1944 (the final year of the WWII drought). Winter and spring maps from the last few decades also more red patterns than blue, illustrating the drying trend we are seeing at that time of year across much of southern Australia.
Note: this map was prepared by Jarrad Rowe, a then undergraduate student at The University of Melbourne, supported by a scholarship from the ARC Centre of Excellence for Climate Extremes.
